
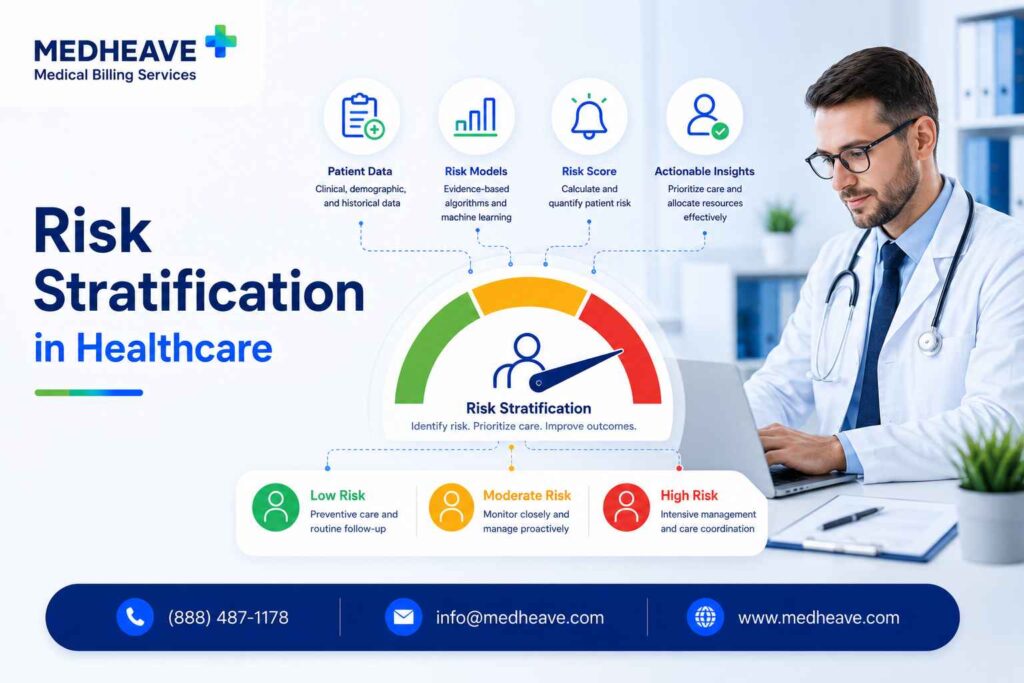
Risk stratification is the process of categorizing patients by their likelihood of experiencing adverse health events — hospitalization, emergency department visits, disease progression, or high-cost care — so that clinical teams can match care intensity to patient need.
The American Academy of Family Physicians describes it as a two-step process that combines objective claims or EHR data with subjective clinical assessment to identify patients who need more focused care management.
In value-based care models, risk stratification determines who receives preventive outreach, who gets assigned a care manager, and who needs intensive interdisciplinary support.
Let’s look more into risk stratification, and explore:
- Common risk tiers and how they translate to care actions
- Common mistakes that weaken stratification programs
- How risk stratification differs from risk adjustment
- The two-step process for stratifying patients
- What data feeds a risk stratification model
- Real-world examples by patient type
What data goes into risk stratification?
Risk models pull from multiple sources — and the accuracy of the output depends entirely on the completeness and recency of the input.
| Data type | Examples | What it adds |
| Demographics | Age, sex, geography | Baseline population-level risk context |
| Clinical history | Chronic conditions, comorbidities, ICD-10 diagnoses | Complexity and disease burden |
| Utilization | ED visits, admissions, readmissions | Signals instability or care gaps |
| Claims data | Diagnoses, procedures, pharmacy fills | Population-level patterns across payers |
| EHR data | Vitals, labs, medications, problem lists | Real-time clinical detail |
| Medication data | Polypharmacy, adherence gaps | Safety and adherence risk |
| Social drivers | Transportation, housing, food insecurity, health literacy | Barriers that clinical data alone misses |
| Care-team input | Functional status, family support, recent deterioration | Context that no algorithm captures |
Johns Hopkins ACG describes risk grouping based on predictive cost, clinical, social, and behavioral factors.
The strongest stratification models combine objective data (claims, labs, utilization) with subjective context (clinician observations, social drivers, patient goals) because neither source is complete on its own.
In practice, the most common failure is relying exclusively on claims data.
Claims lag behind clinical reality by weeks or months. A patient whose diabetes is newly uncontrolled shows up in EHR data immediately but may not appear in claims until the next billing cycle — by which point the window for early intervention has narrowed.
Two-Step Data Approach
Step 1 — Objective Data
Claims history, ICD-10 codes, lab values, ED visits, hospitalizations, pharmacy fills, HCC scores
Step 2 — Subjective Context
Care-team observations, functional status, social barriers, medication adherence, family support, recent changes
What are the common risk stratification levels?
Risk categories vary across organizations, but most healthcare stratification programs use some version of a tiered model — typically three to six levels.
| Tier | Meaning | Typical care approach |
| Low risk | Generally healthy or stable chronic conditions | Preventive care, routine screenings, annual wellness visits |
| Rising/moderate risk | Early warning signs — uncontrolled condition, missed visits, increasing utilization | Chronic disease coaching, care-gap closure, medication adherence support |
| High risk | Multiple comorbidities, frequent utilization, significant care needs | Assigned care manager, longer visits, medication reconciliation, post-discharge follow-up |
| Complex/very high risk | Serious instability, repeated admissions, end-of-life needs, severe social barriers | Intensive interdisciplinary support, home-based services, advance care planning |
AAFP uses a more granular six-level model. Aledade segments patients into low, rising, high, and catastrophic risk groups. NACHC describes grouping patients into high, medium or rising, and low-risk groups as a common starting framework.
The exact number of tiers is less important than whether each tier triggers a specific, documented care action. A risk score without a matching intervention is just a dashboard metric.
How does the two-step stratification process work?
AAFP describes step one as sorting patients by objective data from claims or the EHR, then adjusting based on subjective considerations from the care team.
Step 1 — objective scoring
Pull historical data to assign preliminary risk tiers. Inputs include:
- HCC risk scores
- Prior authorization history
- Lab values outside normal range
- Medication burden and adherence gaps
- ICD-10 diagnoses and comorbidity counts
- Claims-based utilization (ED visits, hospitalizations, readmissions)
Step 2 — clinical and social adjustment
The care team reviews the objective tier and adjusts based on information algorithms cannot capture:
- Did a recent life event change the patient’s care trajectory?
- Is the patient engaged and improving, or disengaged and deteriorating?
- Are social barriers (transportation, food insecurity, housing) increasing risk?
- Is the patient functionally declining despite stable claims data?
Step 3 — assignment and reassessment
The adjusted risk level gets documented in the EHR or care registry and linked to a care model. Risk levels should update after hospitalizations, new diagnoses, ED visits, social changes, or significant improvement.
AHRQ emphasizes that practices should identify which patients are likely to benefit from more intensive care management rather than applying the same coordination level to everyone.
The purpose of stratification is not labeling — it is matching resources to need.
What does risk stratification look like in practice?
Concrete examples show how stratification translates from data to care decisions.
| Patient profile | Objective data | Contextual data | Likely tier | Care response |
| Healthy adult, overdue screenings | No chronic disease, no recent utilization | Good access, stable support | Low risk | Preventive reminders, annual wellness |
| Type 2 diabetes, rising A1C | A1C above goal, 2 missed visits in 6 months | Transportation barriers | Rising risk | Outreach call, diabetes education, care-gap closure |
| CHF with recent ED visit | 2 admissions in 90 days, polypharmacy | Lives alone, limited food access | High risk | Assigned care manager, pharmacist review, weekly follow-up |
| Frail older adult, multiple conditions | Recent fall, 3 specialists, declining function | Limited family support, cognitive changes | Complex | Interdisciplinary care plan, home support, advance care planning |
The rising-risk tier is where many organizations have the largest return on investment — because early intervention can prevent the costly hospitalizations and ED visits that high-risk patients already experience.
Many programs over-focus on high-risk patients and under-invest in the rising-risk group, where the care trajectory is still modifiable.
How does risk stratification support value-based care?
In fee-for-service, every visit generates revenue regardless of outcomes. In value-based care (VBC), organizations share financial accountability for the health of a population — which makes identifying who needs what level of care a financial imperative, not just a clinical one.
Risk stratification supports VBC by:
- Matching outreach intensity to patient complexity
- Supporting efficient use of care management staff
- Prioritizing care-gap closure for quality measure performance
- Providing data for shared savings calculations and performance reporting
- Identifying patients who would benefit from care management before avoidable hospitalization
Aledade frames risk stratification as a way to segment patients by medical complexity and allocate resources to reduce avoidable costs while improving outcomes.
ACOs, Medicare Shared Savings Program participants, and value-based primary care organizations use stratification as the operational backbone of population health management.
How is risk stratification different from risk adjustment?
The two terms get conflated constantly in value-based care conversations, but they serve different purposes.
| Dimension | Risk stratification | Risk adjustment |
| Primary purpose | Guide care, outreach, and resource allocation | Adjust payment or performance comparisons for patient complexity |
| Primary users | Care teams, population health managers, practice leaders | Payers, CMS, ACOs, health plans |
| Main inputs | EHR, claims, labs, utilization, SDOH, clinical judgment | Diagnoses, demographics, model-specific factors |
| Main output | Care tier or risk category | Payment or performance risk score (RAF) |
| Main risk | Under-identifying patients who need help | Overcoding or unsupported diagnosis documentation |
CMS-HCC risk adjustment estimates expected costs for Medicare Advantage enrollees and assigns risk scores that affect plan payment.
Clinical risk stratification categorizes patients by care needs to guide operational decisions. A patient can have a high HCC risk score (expensive diagnosis mix) but low clinical risk (stable, well-managed conditions) or the reverse.
The danger of confusing the two — treating HCC coding as a clinical risk exercise can lead to documentation patterns that inflate payment risk scores without improving care delivery.
What mistakes weaken risk stratification programs?
Here are a list of mistakes to weaken risk stratification programs:
| Mistake | Why it matters | Better approach |
| Relying only on claims data | Claims lag behind clinical changes by weeks or months | Combine claims, EHR, and care-team input |
| Ignoring social drivers | Clinical risk may underestimate total risk | Screen for transportation, housing, food, support, literacy |
| Treating risk as static | Patient conditions change constantly | Reassess after hospitalizations, new diagnoses, and social changes |
| Focusing only on high-risk patients | Rising-risk patients may be more impactable | Build interventions for every tier, not just the top |
| Scoring without workflow | Risk scores do not improve outcomes by themselves | Link each tier to documented care actions and team roles |
| Overcoding or unsupported diagnoses | Creates compliance and payment risk | Document accurately based on clinical evidence |
| Not measuring outcomes | Cannot tell if the program works | Track ED visits, hospitalizations, care gaps, patient experience, and cost |
A 2025 systematic review notes that population risk stratification tools are used to tailor interventions, prioritize resources, and proactively manage high-risk people with chronic disease in primary care — but the review also found wide variation in how well those tools actually predict outcomes across populations.
The strongest programs treat stratification as an ongoing operational cycle — score, adjust, act, measure, and re-score — not a one-time data exercise.
How do you implement risk stratification in a practice?
NACHC summarizes an approach that starts with compiling a patient list, sorting by condition, stratifying into target groups, and designing care models for each risk group.
A practical implementation checklist:
10 Steps to Build an Effective Risk Stratification Process
Complete each checkpoint before implementing your population health strategy.
For most primary care organizations, the first implementation cycle reveals as much about data quality and workflow gaps as it does about patient risk.
Missing problem lists, outdated medication records, and incomplete social screening all surface during stratification — and fixing those issues improves the accuracy of future risk scoring.
You stratify patients by clinical risk. MedHeave stratifies claims by revenue risk.
Identifying high-risk patients is a clinical priority. Identifying high-risk claims — the ones most likely to be denied, downcoded, or stalled in AR — is a revenue priority. Most practices do one well but not both.
- MedHeave monitors every claim from submission through final payment
- Denials are caught through ERA monitoring and reworked the same day
- Dedicated account managers report weekly on AR aging, denial trends, and collection rates
- High-risk claim patterns (prior auth failures, modifier issues, payer-specific quirks) get flagged before submission
Talk to MedHeave about building revenue cycle operations that catch payment risk before it becomes lost revenue.
Frequently asked questions
Here are some frequently asked questions on this topic:
Risk stratification in healthcare is the process of grouping patients by their likelihood of experiencing adverse events — hospitalization, ED visits, disease progression, or high-cost care — so that clinical teams can match care intensity to patient need. It combines objective data (claims, diagnoses, lab values, utilization patterns) with clinical and social context (care-team observations, functional status, social barriers) to assign patients to risk tiers that trigger specific care actions and follow-up protocols.
Most healthcare risk stratification programs use three to six tiers. A common four-level model includes low risk (healthy or stable), rising or moderate risk (early warning signs of worsening health), high risk (multiple comorbidities, frequent utilization), and complex or very high risk (serious instability, end-of-life needs, severe social barriers). The exact tier labels and cutoffs vary by organization, but each level should trigger a documented care response — not just a score.
A primary care practice identifies a patient with type 2 diabetes whose A1C has risen above goal over two consecutive visits and who missed a scheduled follow-up. Claims data shows no recent hospitalization, but the care team notes transportation barriers. Objective data places the patient at moderate risk. After adding social context, the team moves the patient to rising risk and assigns outreach, diabetes education, and a care-gap closure visit within 30 days.
No. Risk stratification guides clinical care decisions by categorizing patients into tiers that trigger interventions, outreach, and care management. Risk adjustment is a payment mechanism — CMS-HCC risk adjustment assigns financial risk scores that affect Medicare Advantage plan reimbursement based on documented diagnoses. A patient can have a high payment risk score but low clinical risk (well-managed chronic conditions) or the reverse. The two systems use different inputs, serve different purposes, and should not be conflated.
Risk scores should be reassessed after any major clinical event — hospitalization, ED visit, new diagnosis, significant lab change, or functional decline. Most population health programs run formal reassessments quarterly, with ad hoc updates triggered by clinical events between cycles. Social factors like housing changes, job loss, or loss of a caregiver also warrant reassessment. Treating risk as a static label rather than a dynamic indicator is one of the most common implementation mistakes.

